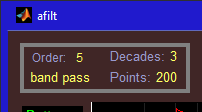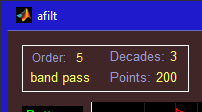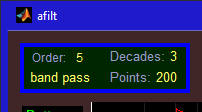
| H = plt('box',pos, 'Property1',Value1, 'Property2',Value2,...) | A new axis is created to group other user interface control objects. pos specifies the position of the axis object as [xleft ybottom width height]. If all four of these numbers are less than 5, normalized units are assumed, otherwise, pixel units are used. If any property/value pairs (optional) appear in the argument list, these properties are applied to the axis object created. The handle of the new axis is returned in H. |
| H = plt('box',pos,[r g b], 'Property1',Value1, 'Property2',Value2,...) | This is equivalent to: H = plt('box',pos,'color',[r g b],'PropName1',PropValue1,...) You can use either of the alternate color specification methods described in the the color section. So for example, the following two commands are equivalent: plt('box',pos,[.66 .11 .77]); plt('box',pos,661177); You can also use the string 'none' to indicate that the axis background color should be the same as the figure background color. (Other character string color representations such as 'blue' are not allowed here.) |
| H = plt('box',pos,[r g b], [R G B], 'Property1',Value1, 'Property2',Value2,...) | This is equivalent to: H = plt('box',pos,'color',[r g b],'xcolor',[R G B],'ycolor',[R G B],'PropName1',PropValue1,...) This surrounds the box with a border of the specified color. The default linewidth of this border is 3 but can be changed by using 'linewidth' as one of the property names in the argument list. As before, you may replace [R G B] with a single number using the alternate color format but you can't use a string such as 'red'. |


 If the first argument (pos) is a cell array of length n, then the command
creates n pseudo box objects., If a parameter is a cell array of length n, then the nth element of
that cell array is used for the corresponding parameter for each pseudo box object. Otherwise, the
entire parameter is used for the corresponding parameter of every pseudo box object. For example,
try typing the following command into the command window:
| demo folder: | gui1, pltmap, xChart |
| math folder: | carlo, gpsLog |
| sig folder: | afilt, editz, erip, fseries |
| util folder: | pltwater |